The questions list shows a lot of information about each question, but even more is available on the question details page.
The top section of the question details page shows the question results. The question results contain:
- The text of the question as asked
- Rach of the possible answers
- The response counts
- A chart showing the share of each response.

Results are displayed as a horizontal bar chart by default, but you can use the buttons at the lower right to switch to a vertical bar or donut pie chart. The margin of error, number of responses, and date range during which those responses were gathered are shown in the lower left. If you wish to print or export the results, click the hamburger menu above the chart to the right. You can download the chart in PNG, JPEG, PDF, or SVG formats or download the data as a CSV or XLS file. You can also view the data table.

About midway down the page, you'll see headers labeled Results and Settings.

There are two or three sub-tabs on the question results page under results, depending on the question: TimeView, Compare, Insights, Segments, and Geography.
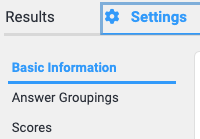
Under Settings, we see Basic Information, Answer Groupings, and Scores.