It's one thing to know how to create a segment. You may have wondered why you would do that, though.
Segments allow us to focus on better understanding how a certain group of people makes decisions. What are their behaviors or preferences? How do they compare to a second group in those matters?
The InsightStore's segment feature enables us to define an age range, household income, location, and more, allowing us to zero in on the segment of interest. We can then use that segment to examine how these consumers responded to specific questions. For instance, we can determine which wireless carrier is most popular among them or where they prefer to bank. We can compare the segment to the general population to identify where they differ, or define multiple segments and compare groups of consumers to one another. Segmenting allows us to better understand consumers' preferences and needs.
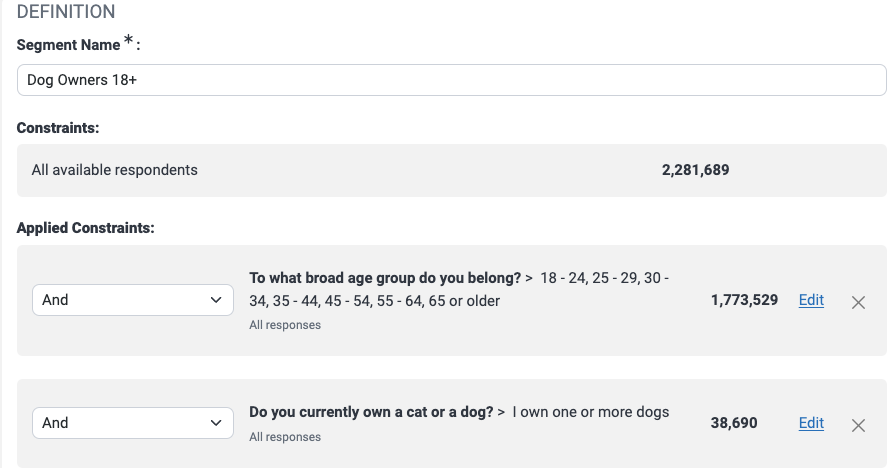
Let's go through the process together. To gain a deeper understanding of adult dog owners, we would create a segment for individuals aged 18 and older who own dogs.
Let's use the segment compare function to see how this group differs from the general population. There are multiple areas covered in the comparison, but I want to focus on the demographic where our group differs the most: age. Our group skews older.

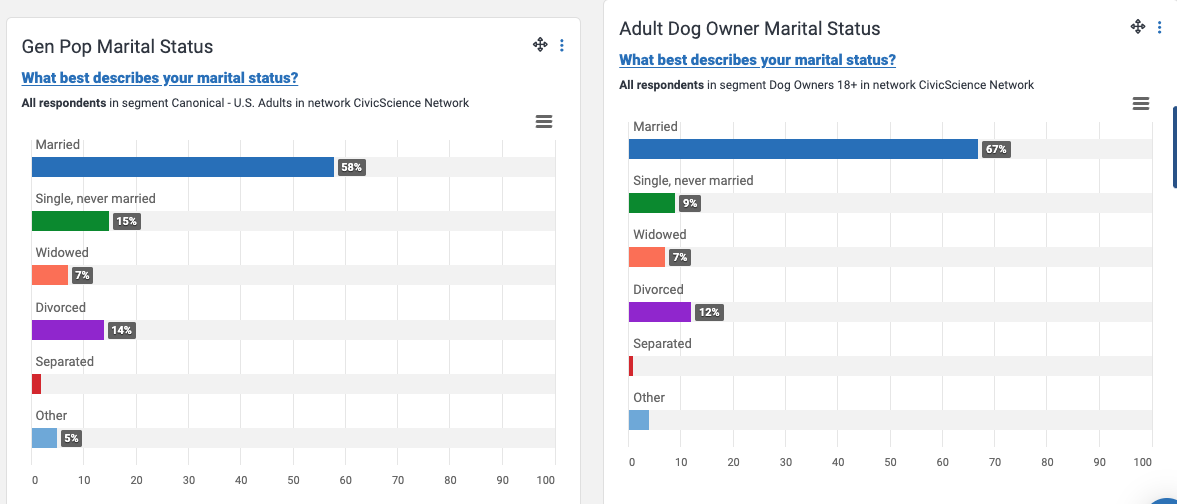
We could also use a dashboard to compare the new segment to the general population. The adult dog owners seem more likely to be married.
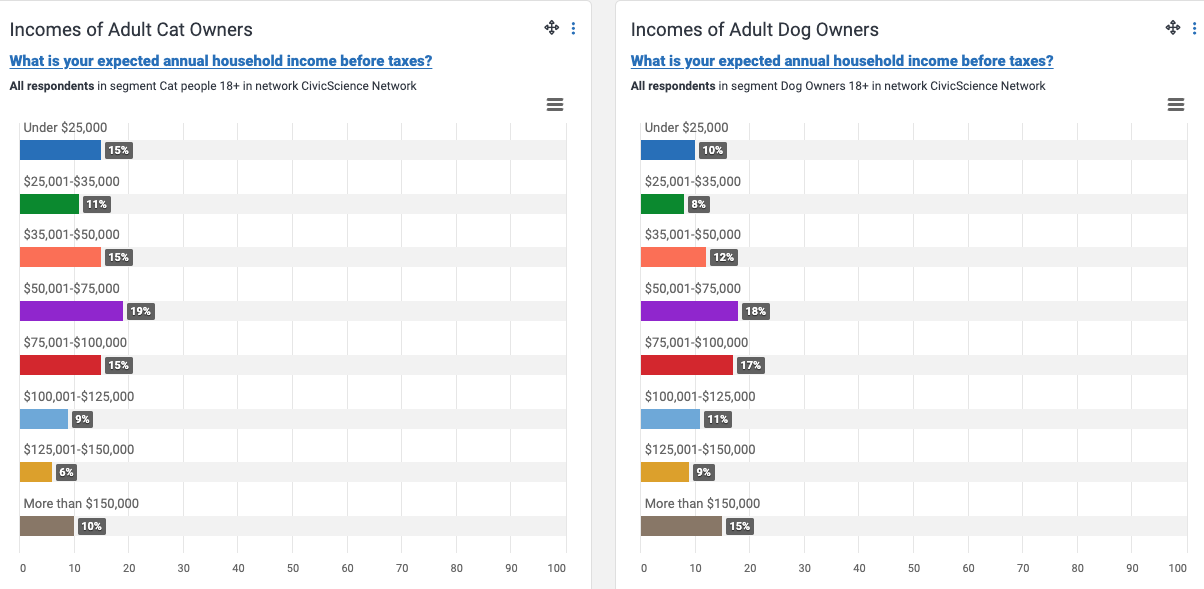
We could also compare dog owners and cat owners. That's interesting - there are more cat owners with household incomes under $25,000 and fewer with incomes more than $150,000.
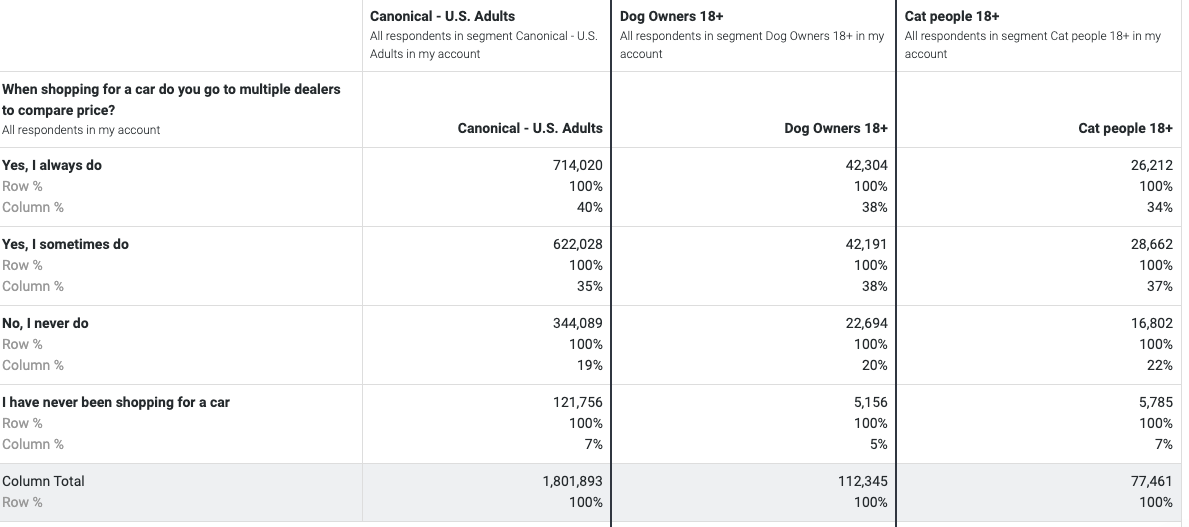
Let's switch over to a behavioral difference and use a crosstab report to see our figures. It seems that our cat owners are less likely than dog owners or the general population to go to multiple auto dealers to comparison shop for a new vehicle.
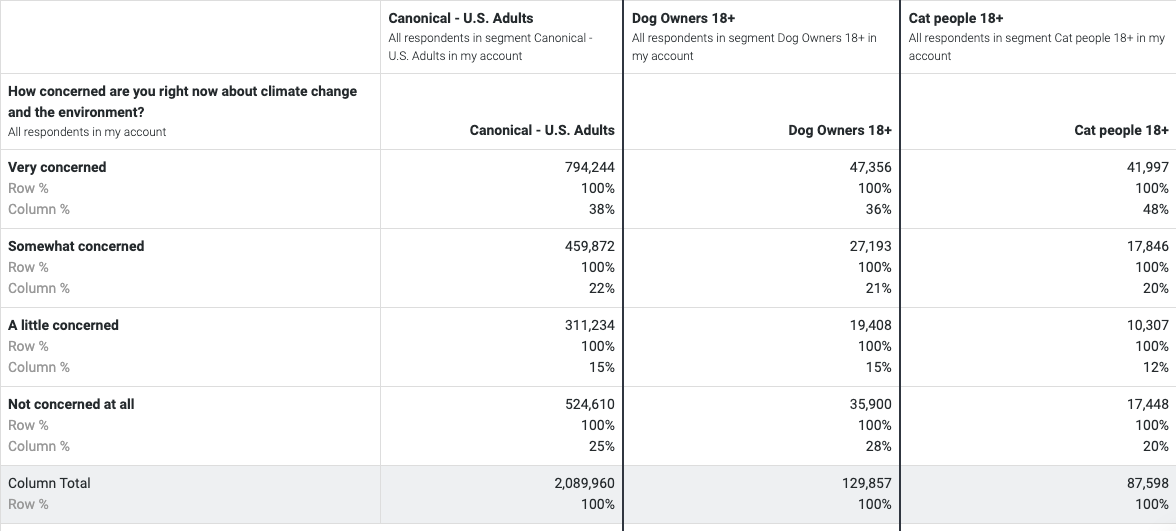
We can look at psychographic data, too. It appears that cat owners are more likely to say they're very concerned about climate change and the environment than either dog owners or the general population.
By making different comparisons using segments, we can learn a great deal about our consumers and their preferences. It's like piecing together a puzzle, and with each comparison, the picture becomes clearer and more fascinating. Let's keep exploring and see what other discoveries await us!